On this page
It tracks and alerts. It never trades.
A self-hosted terminal for the US market: a watchlist that opens on the day's moves, charts with every indicator computed on the server, alerts that reach your own Slack or Telegram after the close, a screener over ~600 symbols, company financials read straight from SEC filings, market-moving news with an AI's read of each item, an AI research assistant on your own key, and a portfolio you keep by hand. No broker connection, no order entry, and nothing about you sold to anyone.
Your watchlist, and a page for every stock
TraderBuddy opens on your watchlist. Each stock shows its price, the day's move and a small chart of the last session, with SPY, QQQ, DIA and IWM above the list for the market's mood. Sort by your own order, % change or A–Z.
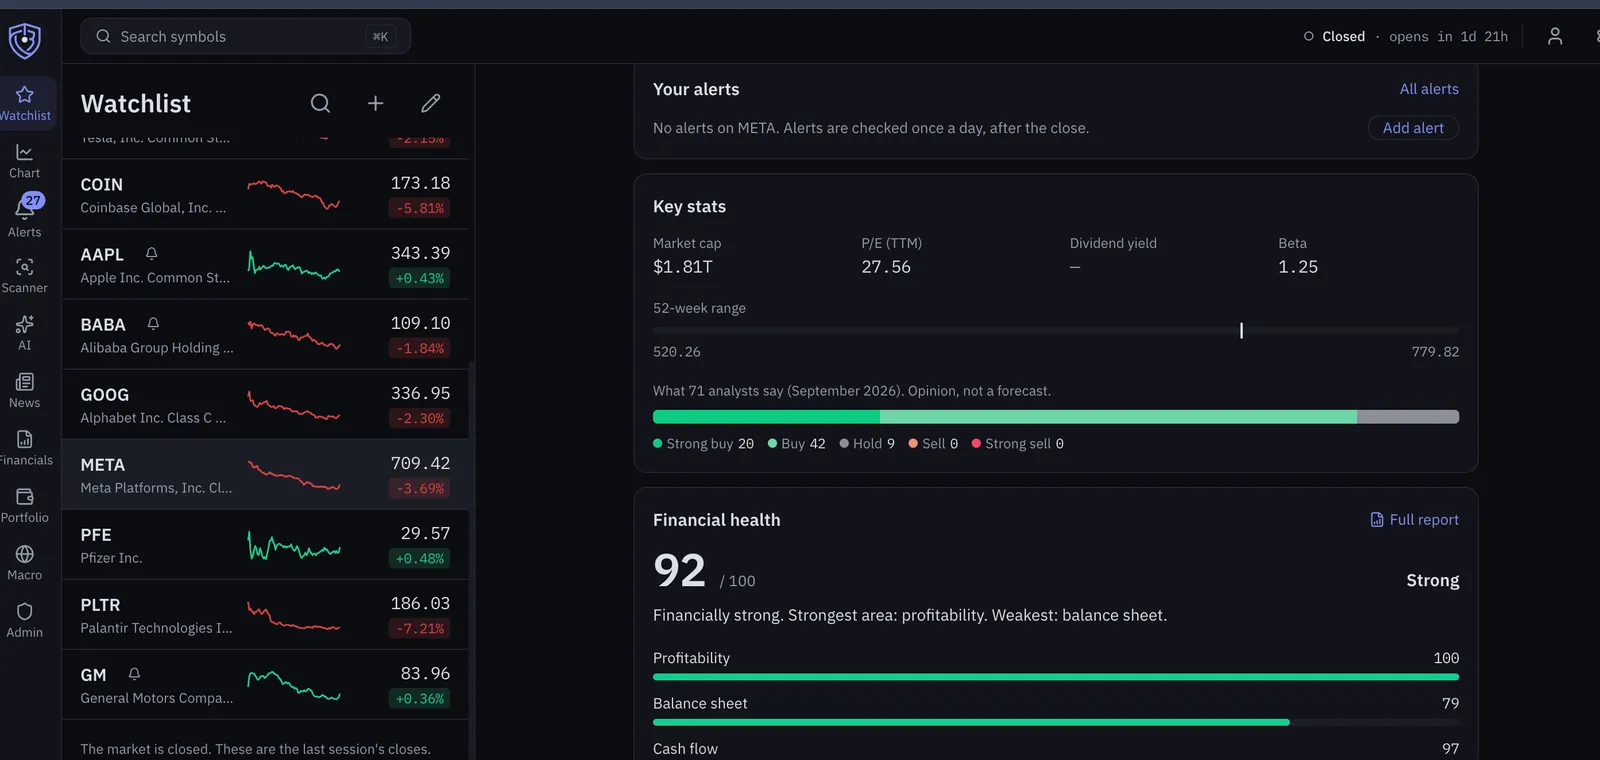
- It knows what is yours. A dot marks what you hold and a bell marks stocks with active alerts.
- Fresh while it matters. Prices refresh every 15 seconds while the market is open. When it is closed, the list says it is showing the last close.
- A page for every stock (
/stock/NVDA): the price and day change, a chart with 1D to 5Y ranges, what you hold in it and your alerts on it, market cap, P/E, dividend yield, beta, the 52-week range, analyst ratings, a financial-health summary and its latest news. Watch, Add alert and Ask AI are one tap from the top. - Made for a thumb. Swipe a row left to remove it, and Edit reorders with arrows. An empty list offers SPY, QQQ, AAPL, MSFT and NVDA in one tap each.
The chart
The full drawing chart is the Chart tab. Open a symbol and you get candles from one minute to one week, drawn from closed bars cached on the server with one live forming bar on top. Scroll back and deeper history loads.
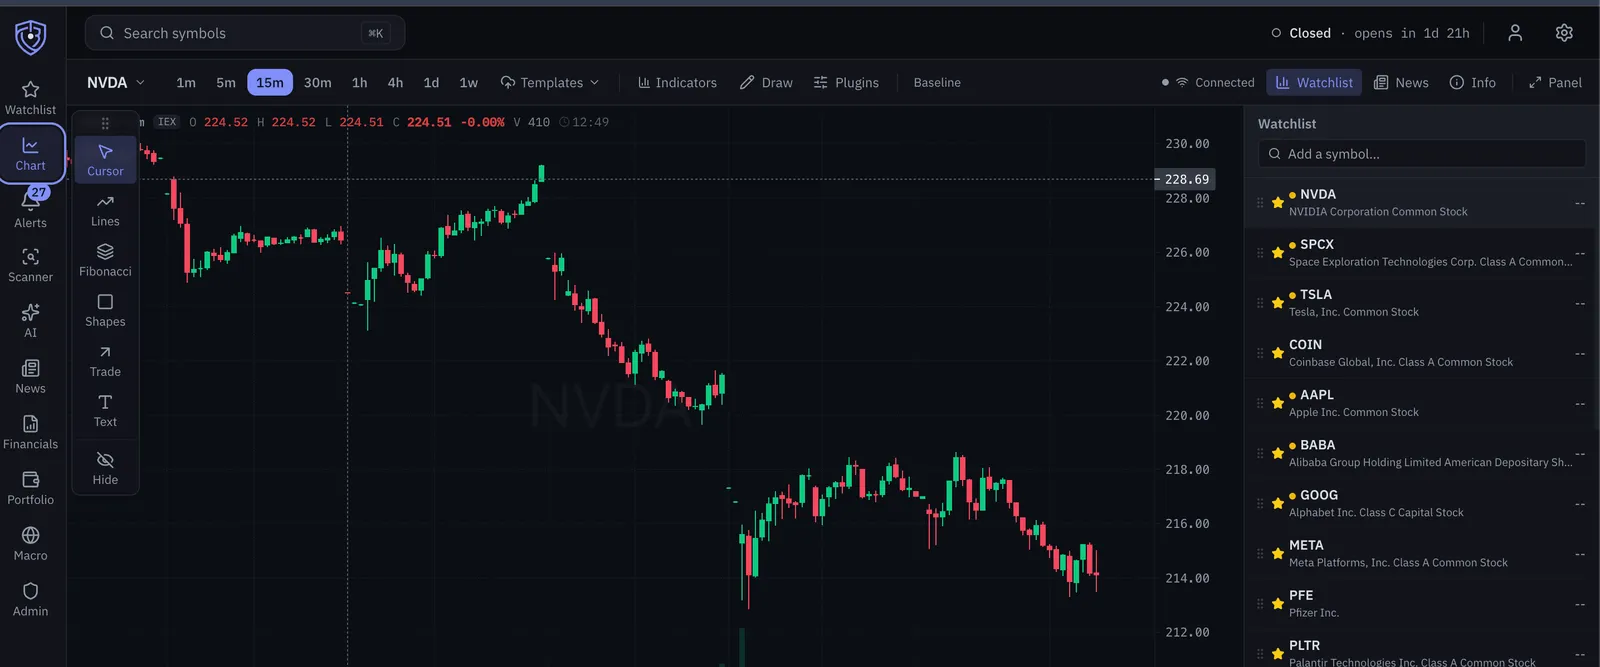
- Indicators, computed server-side. SMA, EMA, RSI, ATR, VWAP, MACD, Bollinger Bands and Stochastic. Your browser draws them; it never calculates them, so the chart and an alert can never disagree.
- Drawing tools. Trendlines, horizontals, rectangles and text, with magnet snapping, undo and redo, and an object tree. Everything is saved per symbol and waiting when you come back.
- Live where it counts. Real-time prices stream for the symbols you have open. The rest are polled and labelled delayed, so you always know which number you are looking at.
- Baseline mode. Show closes against a reference instead of in absolute terms: since you added the symbol, 1W, 1M, 3M, YTD or 1Y. The legend names the reference price and its date.
- Info and news beside the chart. Profile, P/E, P/B, dividend yield, beta, a 52-week range bar and analyst ratings, marked as opinion. News follows your watchlist and falls back to market news when it is empty.
- Symbols you hold are marked. A dashed average-cost line on the chart and a dot in the watchlist, so a position never gets lost between pages.
- Search from anywhere.
⌘Kfinds any symbol.↵opens its page,⌘↵adds it to your watchlist. What you type is never logged. - Usable on a phone. The chart keeps the screen: the toolbar is two rows, with Watchlist, News and Info together under one Panels button. Watchlist, Chart, Alerts and Portfolio are tabs along the bottom, and the rest, Scanner included, are under More.
- Dark, light, or your device's choice. Pick the palette in Settings; it stays on that device. A market clock in the top bar says whether the market is open and when that changes.
Alerts
Draw a line where you care about the price, turn on its bell, and TraderBuddy watches that level for you. Or create one from the Alerts page, where every alert you own is listed, editable, renewable and deletable.
The timing is the part worth knowing before you rely on it: alerts are checked once per trading day, after the US close, on that session's one-minute bars. That is a deliberate trade — the real-time budget belongs to the charts you have open — and it means an alert tells you on the evening of the day something happened, not the second it happens. The single exception is opening movers, below.
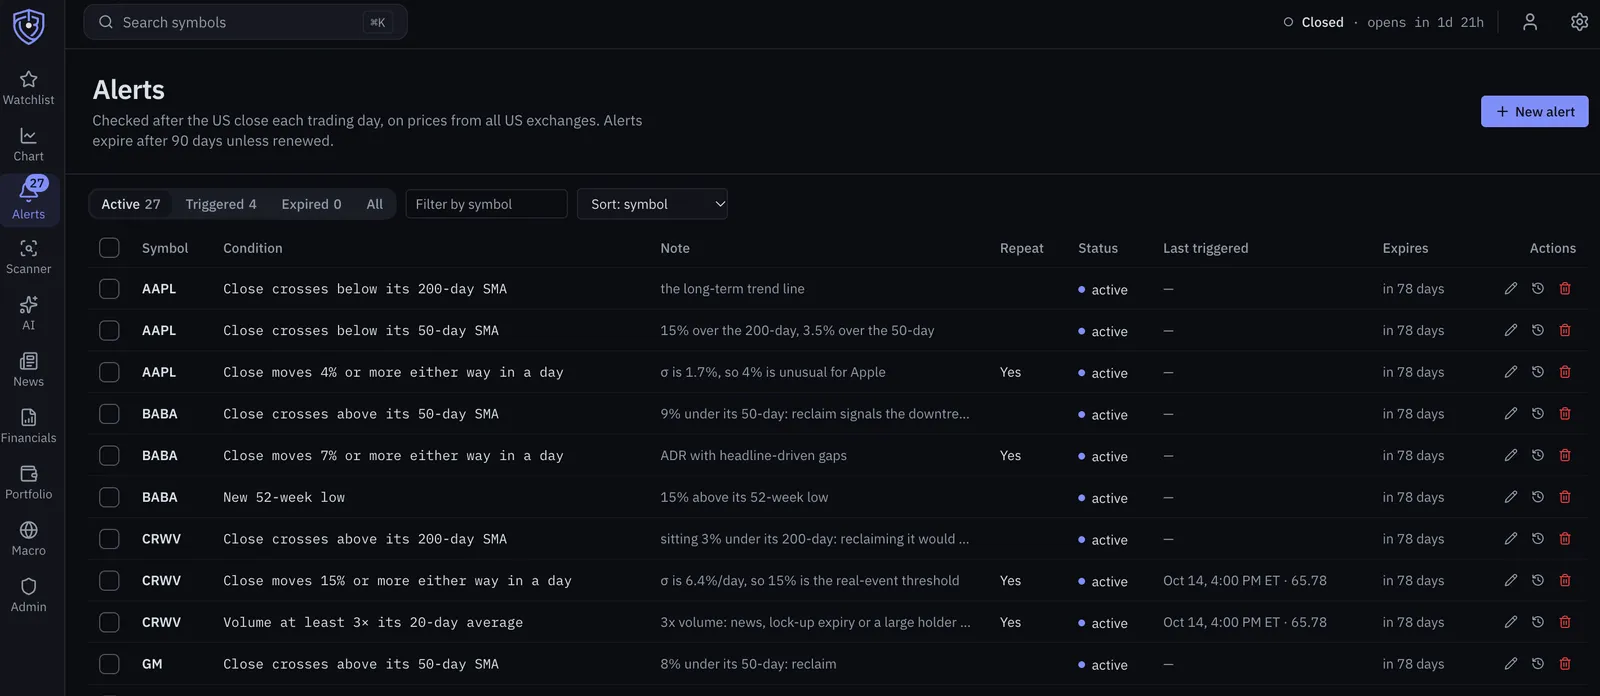
- Price levels. Crosses above, below, or either. On a trendline, the level is read along the line at the moment of checking, so a sloping level stays correct as time passes.
- Conditions, not just levels. A close crossing its SMA or EMA, a golden or death cross, a daily move of X%, a new 52-week or all-time high or low, a volume spike, or RSI crossing a level. Any symbol in the universe, ETFs included.
- Told what happened. A condition alert says what occurred rather than quoting a number: "the 50-day crossed above the 200-day", not "value > threshold".
- Your channels, your credentials. A Slack DM, a Slack channel you pick, a Telegram chat, or a signed webhook. Every enabled channel gets every alert, and one failing never costs you the others.
- A lifecycle, not a graveyard. Alerts last 90 days and then wait for you to renew them, re-arm after they fire, and keep a per-alert history of what happened and when. Renew or delete in bulk.
- The chart agrees with the server. A bell on the chart means a real alert exists on the server. You will never be shown one that isn't actually armed.
Scanner
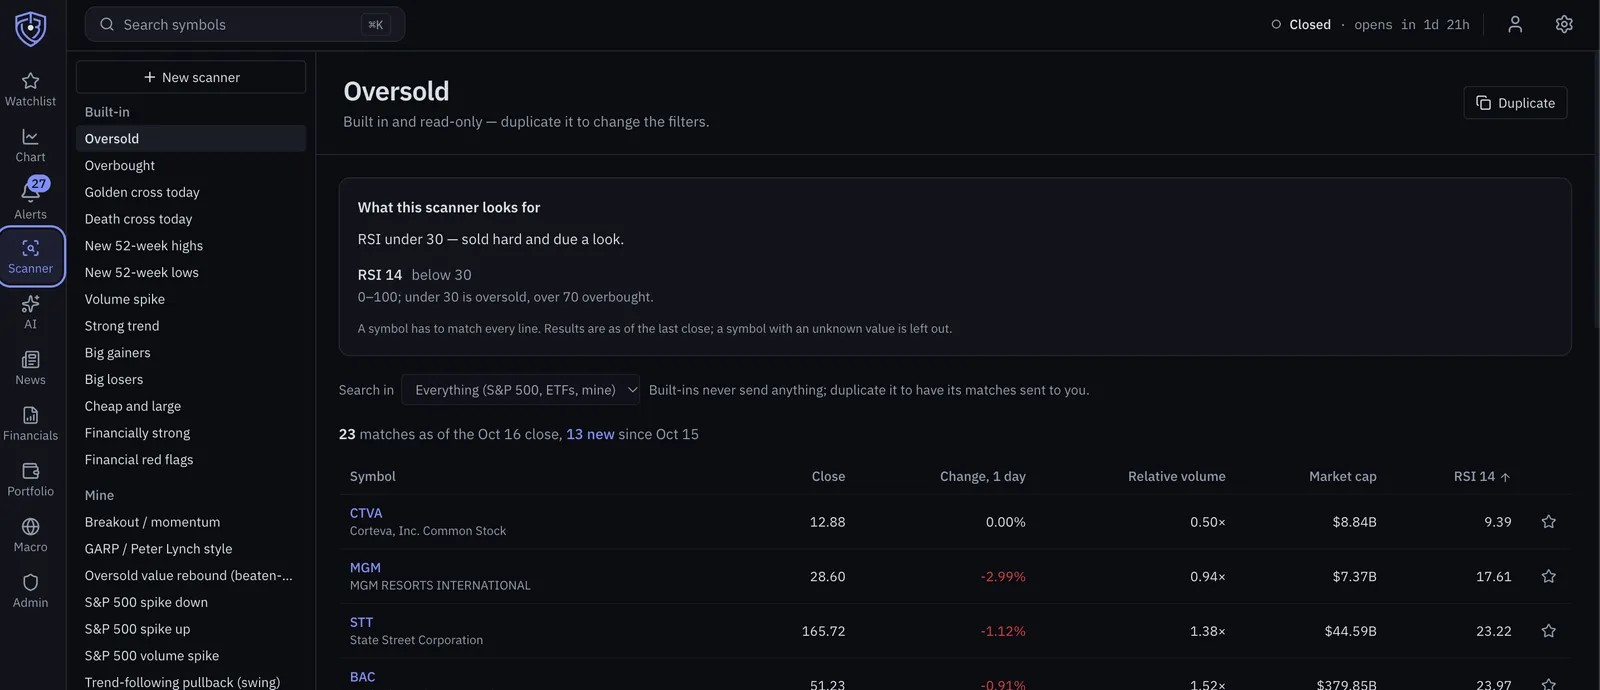
Filter about 600 symbols — the S&P 500, Nasdaq-100 names, roughly 100 ETFs, plus anything on your own watchlist or in your portfolio — on price moves, the 52-week range, volume against its average, SMA 20/50/200, RSI, golden and death crosses, new highs and lows, P/E, market cap and financial health. Thirteen scans are built in. Duplicate one to edit it, or save up to 25 of your own.
Big daily moves · S&P 500
As of the close, Fri 9 Oct 2026
What this scanner looks for
- Index: S&P 500 — the 500 largest US listed companies.
- Change today: above 7% or below −7% — a move far outside a normal session.
- Volume: above 2× its 20-day average — unusual participation, not a quiet drift.
Matches
- Thu 8 Oct:
MRNA— Volume 2.4× its 20-day average (New) - Fri 9 Oct:
MRNA— +14.2% on the day - and twelve more S&P 500 names moved 7% or more that session
A real match: Moderna's 8–9 October spike, caught by a 7% move scan and a 2× volume scan.
- Written in plain language. Every scanner explains itself as you build it: "Debt / equity: below 1× — total debt over equity; under 1 is a lighter balance sheet." You can add a description in your own words.
- Honest about its clock. Results are a snapshot taken after each close, and the page says which close. Symbols that were not matching the session before are marked New.
- It can come to you. Turn on Send matches to my channels — new matches only, or every match — and one message per evening lists what each of your scanners found, every symbol linking to its chart. Nothing is sent on a day nothing matched.
- No false precision. A symbol whose value is unknown — no 200-day average yet, no P/E — never matches a filter on it, instead of being quietly counted as zero.
Financials
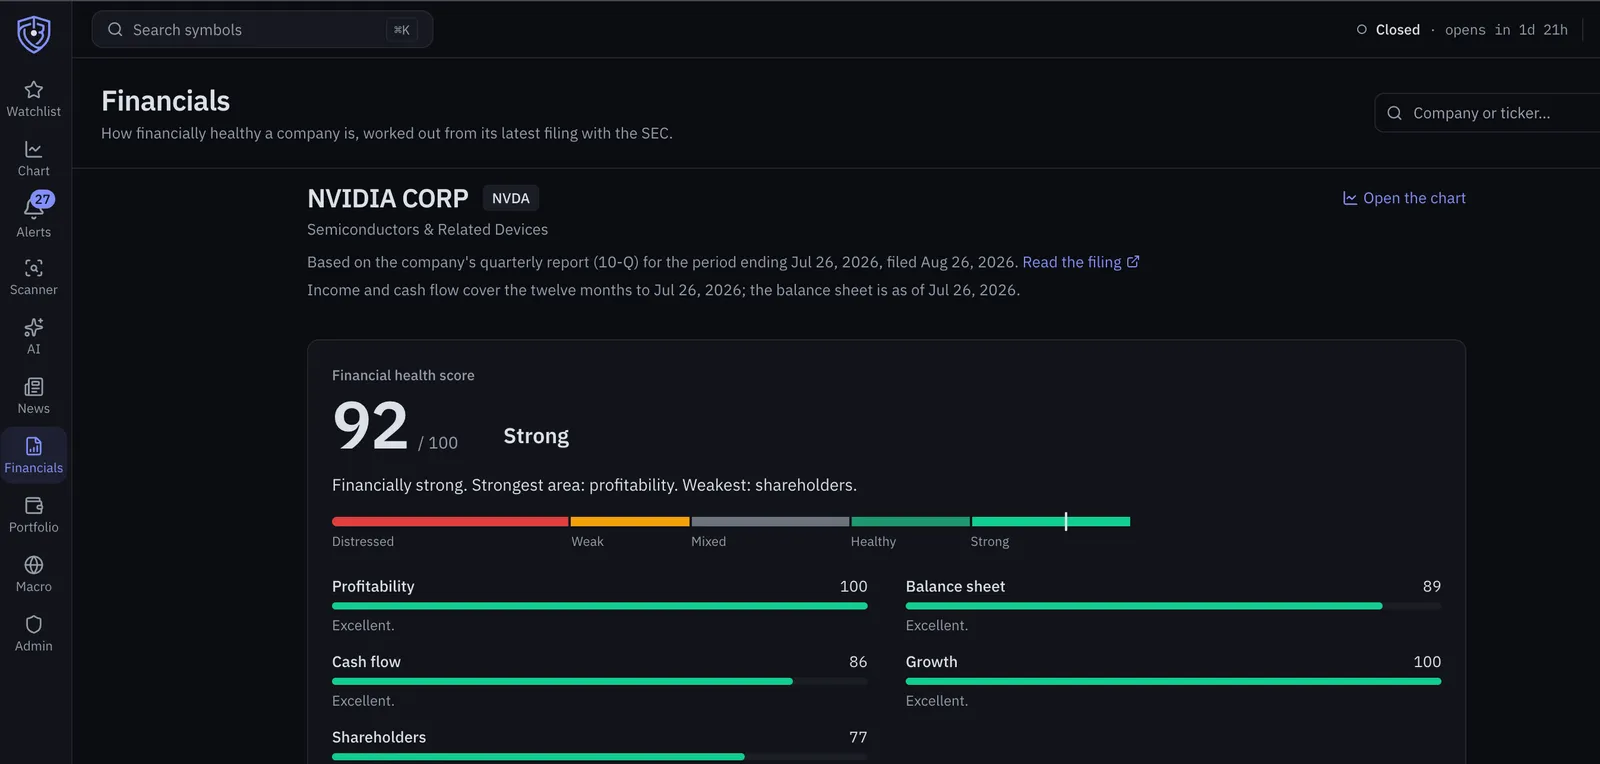
Search a company and TraderBuddy reads its latest 10-K or 10-Q from the SEC, names the filing it used, links to it, and turns it into one score with the five parts behind it.
- Every number in a sentence. Each indicator carries its value, a five-year trend, a good / fair / weak marker and one plain explanation: "Out of every $100 of revenue, $23 is left after the direct costs."
- Two checks shown test by test. The Piotroski F-score's nine pass/fail tests and the Altman Z-score's safe, grey or distress zones, each displayed in full so the score is never a black box.
- The statements themselves. Five years of income statement, balance sheet and cash flow, in line names a person recognises.
- Unknown is never zero. A figure the filing does not report is left out. A part without enough data says so, and a company with too little to go on gets no score at all.
- Banks are judged as banks. For banks and insurers the measures that do not apply are dropped rather than invented, and the page says which and why.
- Not advice. The score summarises what a company reported about its past. It does not forecast the share price, and the page says so plainly.
News, and what it probably means
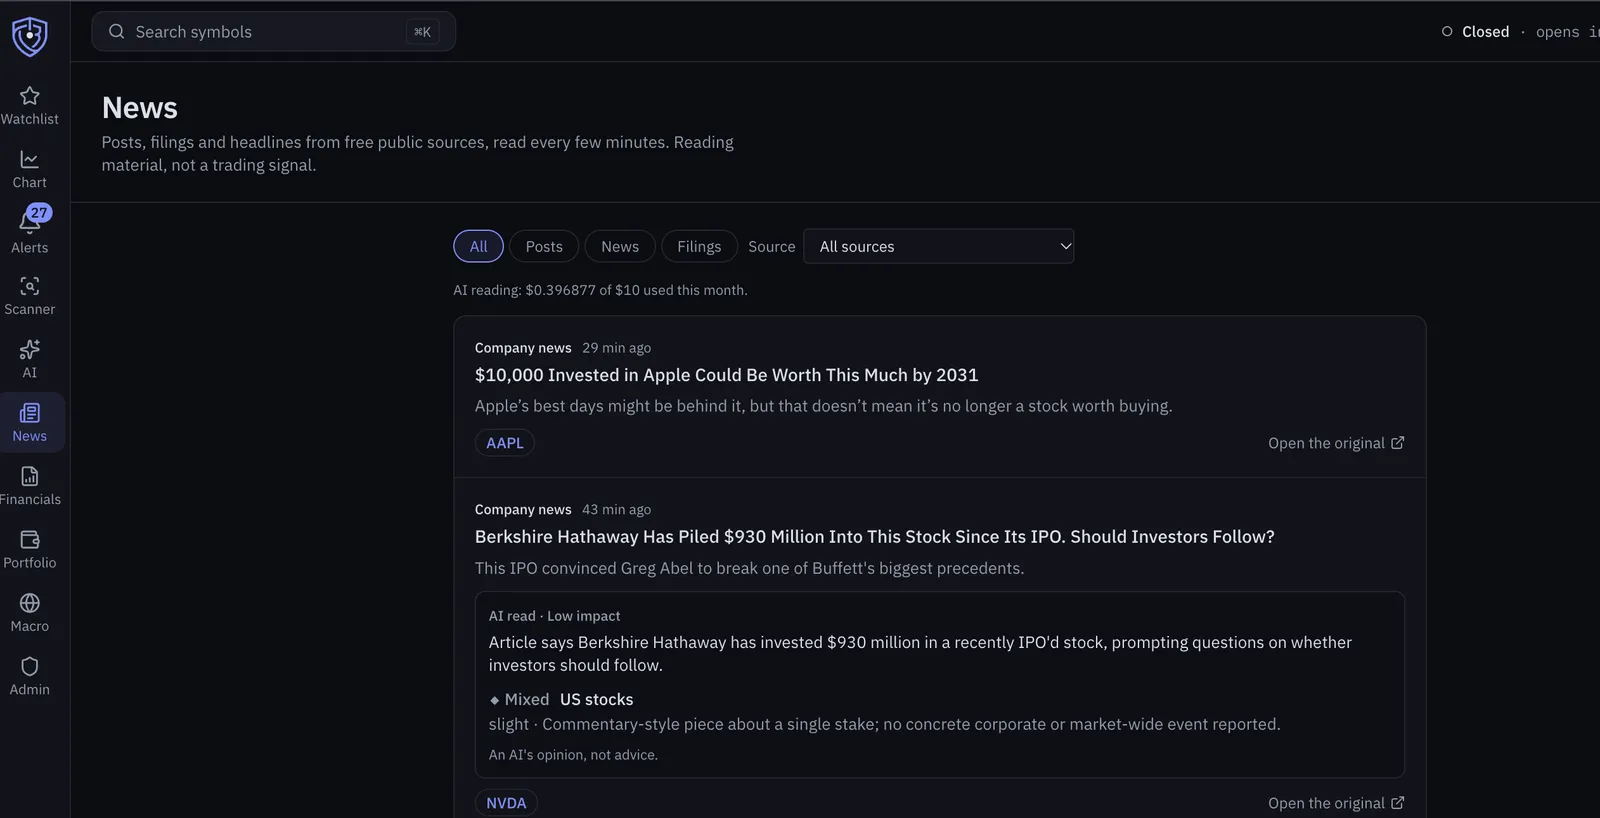
One page for the posts, filings and headlines that move markets, read from free public sources every five minutes and listed newest first, each with who published it and a link to the original.
- Who it reads. Federal Reserve press releases and speeches, White House news, Donald Trump's Truth Social posts (through the independent archive trumpstruth.org), SEC 8-K filings of S&P 500 companies and the symbols you follow, and Finnhub market and company headlines.
- An AI's read of each item. A model (Claude Haiku) says how much an item matters (low, medium or high), sums it up in a line, and names the companies or sectors it is likely to push up or down, and why, even when the item names no company. It is labelled as an AI's opinion, not advice, with the direction in words as well as colour.
- Read once, for everyone. The request contains only the item. Nothing about what you hold or watch leaves TraderBuddy; which items matter to you is worked out afterwards, on the server.
- A hard cap. AI reading stops at $10 a month, checked before every call, and the page shows how much of it is used.
- Honest about its sources. A source that stops answering is named at the top of the page with when it was last read.
An AI research assistant
Pick a model and ask about one stock or a handful: "Compare AMD and NVDA", "What do AAPL's financials say?" It looks things up as it goes, and you see each lookup as it happens. It reads prices and indicators, SEC financials, news, macro series, the scanner and your own watchlist, alerts and portfolio, then answers with the evidence, the bull and bear case, what would change its mind, and how confident it is.
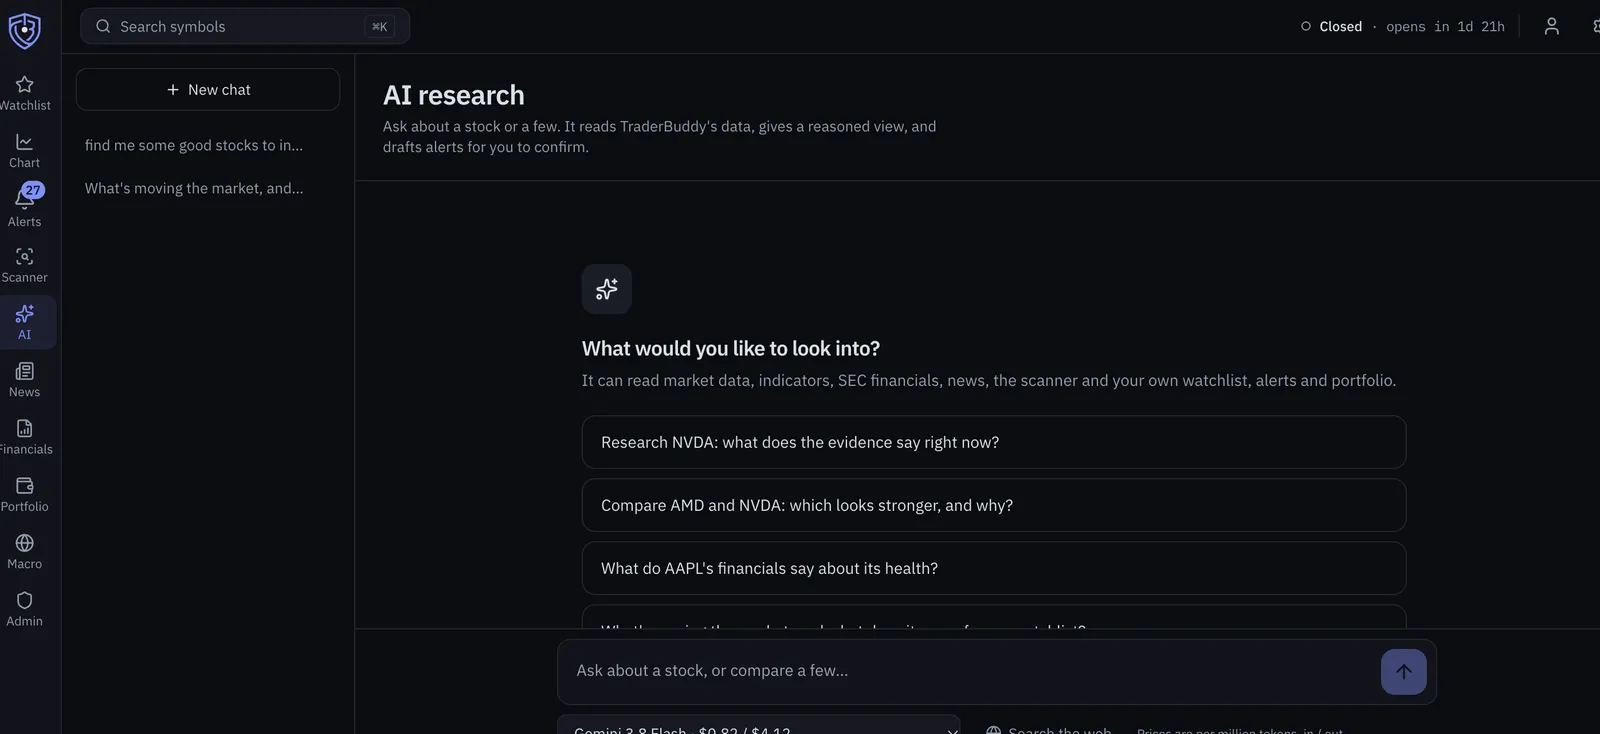
- It drafts; you decide. When it suggests an alert or a watchlist addition it shows a card. Nothing exists until you press Create, and then it goes through the same checks as the Alerts page. It cannot change anything by itself.
- Your own OpenRouter key. Paste it once; it is encrypted and never shown again. You pay OpenRouter directly for what you use, with a spending meter and an optional monthly cap in Settings. There is no shared key.
- Private conversations. They are kept and listed so you can return to them or delete them. Not even an admin can read them.
- Web search is off by default and turned on per message.
Macro context
Eight series on one page: the 10-year and 2-year Treasury yields, the 10y−2y spread, the Fed funds rate, CPI, unemployment, the VIX and the Shiller CAPE. Every figure shows the observation date it belongs to, because a macro number without its date reads as today's when it can be months old.
Colour follows meaning rather than direction, and stops where meaning stops:
| Series | When it rises |
|---|---|
| Unemployment, CPI, VIX, Shiller CAPE | Worse — more joblessness, faster inflation, more stress, a more expensive starting point |
| 10y−2y spread | Better — it is the fall through zero that people watch as a recession signal |
| 10-year, 2-year, Fed funds | Neutral — higher rates are good for savers and bad for borrowers; picking a colour would be editorialising |
Portfolio
A ledger you keep yourself: buys, sells, dividends, splits and fees, typed in or imported from CSV with a preview and per-row errors first. There is no broker connection, by choice. Positions, profit and loss, and history are all derived by replaying what you entered. The page leads with market value, with today's change under it.
- Arithmetic you can trust. Money and quantities are exact decimals end to end, never floating point. Every edit replays the whole ledger, so a backdated sell that would oversell is refused and names the transaction it conflicts with.
- Average cost, stated as such. Positions use average cost rather than tax lots, and the interface tells you that instead of letting you assume otherwise.
- Allocation. By symbol or by sector, with
Unknownshown rather than hidden when a sector isn't available. - Corporate actions flagged. Splits and dividends that look unrecorded are pointed out, and "Record it" pre-fills the transaction. Nothing is ever applied to your ledger automatically.
A daily digest, if you want one
Off until you turn it on, section by section. After the close on trading days, you get one message on the channels you connected, with any section that has nothing to say left out.
TraderBuddy · Thursday 8 October
An example of how it arrives
Portfolios
Core · +$412 today, value $16,480 against $14,000 of cost.
Alerts
AAPL crossed above 230.00. The alert has re-armed.
Watchlist
MRNA +14.2% on 2.4× its usual volume.
News and earnings
Three headlines on symbols you follow, and who reports tomorrow.
It is sent at most once a day. A crash can make it skip a day; it can never send you the same day twice.
Opening movers
One hour after the US open, TraderBuddy looks for S&P 500 stocks running: up 5% or more on yesterday's close and trading at least twice their usual volume for those first minutes, measured against the same minutes of the last ten sessions, because volume is always heaviest at the open.
Opening movers · 10:30 New York
An example of how it arrives
Two S&P 500 names are running an hour into the session.
XYZ +6.4% on 3.1× its usual volume for this part of the morning.
ABC +5.2% on 2.2×.
Prices are 15 minutes delayed
This is the one thing in TraderBuddy that runs during the session, and it is a deliberate exception. It is off until you turn it on in Settings, next to the digest. It arrives on trading days only, at most once a day, and never on a quiet morning. The time is shown in your own time zone, and the message says plainly that its prices are the full-market feed, 15 minutes delayed.
Let a coding agent use it
Claude Code, Cursor and other MCP clients can look symbols up, read your alerts and portfolios, and manage alerts, your watchlist, drawings, saved scanners, the digest and your portfolio transactions on your behalf. Create a token in Settings, paste the URL into your client, and ask in words: "what is NVDA's RSI doing, and alert me if it crosses 70". The step-by-step setup is in How to connect an AI agent to TraderBuddy over MCP.
{ "mcpServers": { "traderbuddy": { "url": "https://trader.smkabir.com/api/mcp/", "headers": { "Authorization": "Bearer tb_pat_…" } } }}A token is shown once, expires between 30 days and a year, and is revoked rather than deleted. It can be read-only or read-and-write. A write token can add and correct portfolio transactions, but never delete one. What it can never touch is fixed in the server, not in the client: your notification credentials, the admin area, deleting from your portfolio, and minting more tokens. And since TraderBuddy has no order entry at all, no agent of yours can place a trade.
Where your data sits
- Your browser talks to one server. Only TraderBuddy's own. No analytics, no third-party widgets, no market-data provider called from your machine. Every provider key stays server-side.
- Searches are not recorded. Nothing logs what you type into ⌘K or the symbol box. Not for you, not for an admin.
- Holdings and alerts are private. Every portfolio, alert and watchlist route is scoped to you; someone else's id simply does not exist. Notifications go to destinations you connected yourself, never a shared channel.
- Credentials are write-only. Slack and Telegram tokens, webhook secrets and your OpenRouter key are encrypted at rest and never returned by any route, to you or to anyone. To change one you replace it.
- What the AI sees, stated. The news reader is sent only the news item. The research assistant, when you use it, sends market data and, when relevant, your watchlist, alerts and portfolio to OpenRouter and the company running the model you chose. TraderBuddy asks for providers that do not keep or train on it, and the AI page says all of this before you paste a key.
- The admin exception, stated. An admin can read any user's watchlist, portfolios and alerts — read-only. Every such read is recorded in an audit log, and the app tells every user this is possible. Your searches, AI conversations and channel credentials stay out of reach.
- Getting an account. Anyone can register; nobody gets in until an admin approves them. Until then you see a waiting screen and nothing else.
What it deliberately does not do
These are choices, not gaps, and they are not going to change:
- Place orders. No order entry, no broker positions, no depth of market, no paper trading.
- Connect to a brokerage. The portfolio is typed in or imported from a CSV.
- Track tax lots. Average cost only, and it says so where it matters.
- Fire alerts on ticks. Once per trading day, after the close.
- Calculate anything in your browser. Indicators, crossings and signals are all server-side.
- Give advice. Analyst consensus is opinion data, an indicator crossing is not a prediction, a financial score is a summary of past filings, and an AI's read is an analysis, not a recommendation.
Features as of version 0.18.0, 18 October 2026. Example figures are illustrations, not real data.